BQ Calculators

Youth Growth Calculator

Where is this young athlete in their growth spurt, how tall are they likely to be as an adult, and when will growth be essentially complete?

What you enter

  • Needed: sex, date of birth, test date and stature (cm).
  • Better with: sitting height (cm) and body mass, which allow the original Mirwald equation.
  • Better still with: both parents' heights, which allow the Khamis–Roche adult height prediction.
What you get

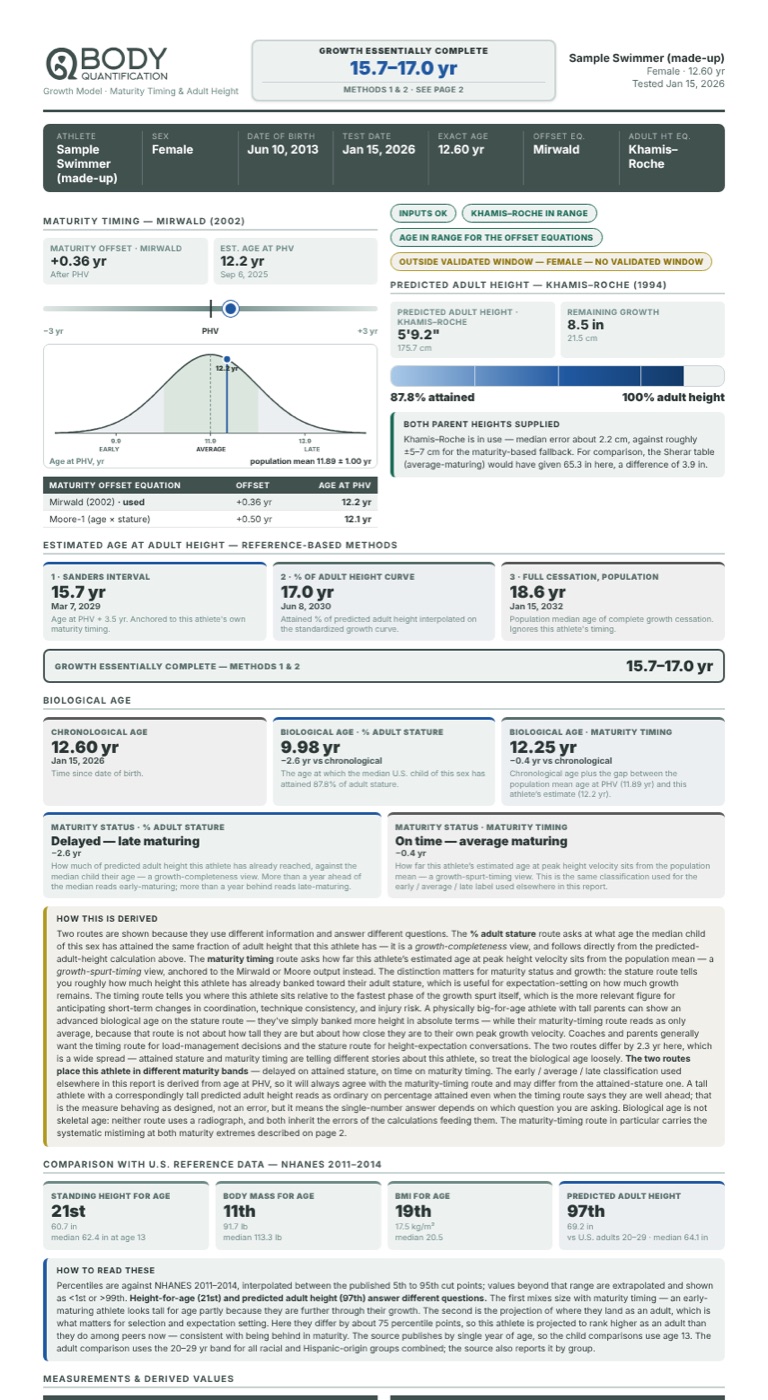
  • Maturity timing: the maturity offset and the estimated age at peak height velocity (PHV), with the date, on an early, average or late curve. A table compares Mirwald, Moore-1 and Moore-2.
  • Adult height: predicted adult height, growth left, and the % of adult height reached.
  • When growth ends: three reference methods, and a "growth essentially complete" range.
  • Biological age two ways (from % of adult height and from maturity timing), each marked early, on time or late.
  • U.S. comparison: NHANES 2011–2014 percentiles for height, body mass, BMI and predicted adult height.
  • Status chips that say whether the inputs are complete and whether the athlete is inside the window where the equations were tested.

A sample report

Page 1 of a sample Youth Growth report for a made up 12 year old swimmer: maturity offset, age at PHV, predicted adult height, when growth ends, biological age and U.S. percentiles

Page 1 of a real Youth Growth report, made for "Sample Swimmer", a made up girl aged 12.6 years with both parents' heights given. Not a real athlete.

Method

  • Maturity offset: Mirwald 2002, with Moore 2015 for comparison. Kozieł and Malina 2018 tested these equations in independent samples.
  • Adult height with both parents' heights: Khamis–Roche 1994.
  • Adult height without them: the Sherar 2005 table of growth left by years from PHV. The table matches Table II of the paper, checked cell by cell (246 values, no differences). Early, average and late follow the paper's rule: within 1 year of the average age at PHV (14.0 for boys, 12.0 for girls) is average.
  • When growth ends: Sanders 2017, Iuliano-Burns 2001 and Thodberg 2012.
  • U.S. percentiles: Fryar 2016 (NHANES 2011–2014).

Limits

  • For athletes under 18 only. Adults are turned away.
  • Age at PHV is an estimate: the equations' error is about 0.5 to 0.6 years. They were tested mainly in average maturing boys within about a year of PHV; they tend to put PHV too late in early maturers and too early in late maturers. The report says whether each athlete is inside that window.
  • Khamis–Roche needs both parents' heights and covers ages 4.0 to 17.5 years. Its median error is about 2.2 cm.
  • Sherar predicts adult height within ±5.35 cm (boys) and ±6.81 cm (girls) 95% of the time. It was built on 224 boys and 120 girls from Saskatchewan, almost all white.
  • Biological age here is not skeletal age: no X-ray is used.

Results are estimates, not medical advice or a diagnosis.

References

  1. Mirwald RL, Baxter-Jones ADG, Bailey DA, Beunen GP. An assessment of maturity from anthropometric measurements. Med Sci Sports Exerc. 2002;34(4):689–694.
  2. Moore SA, McKay HA, Macdonald H, et al. Enhancing a somatic maturity prediction model. Med Sci Sports Exerc. 2015;47:1755–1764.
  3. Kozieł SM, Malina RM. Modified maturity offset prediction equations: validation in independent longitudinal samples of boys and girls. Sports Med. 2018;48:221–236.
  4. Khamis HJ, Roche AF. Predicting adult stature without using skeletal age: the Khamis–Roche method. Pediatrics. 1994;94:504–507; erratum 1995;95:457.
  5. Sherar LB, Mirwald RL, Baxter-Jones ADG, Thomis M. Prediction of adult height using maturity-based cumulative height velocity curves. J Pediatr. 2005;147(4):508–514.
  6. Iuliano-Burns S, Mirwald RL, Bailey DA. Timing and magnitude of peak height velocity and peak tissue velocities for early, average and late maturing boys and girls. Am J Hum Biol. 2001;13(1):1–8.
  7. Sanders JO, Qiu X, Lu X, et al. The uniform pattern of growth and skeletal maturation during the human adolescent growth spurt. Sci Rep. 2017;7:16705.
  8. Fryar CD, Gu Q, Ogden CL, Flegal KM. Anthropometric reference data for children and adults: United States, 2011–2014. NCHS. Vital Health Stat. 2016;Series 3(39).
  9. Thodberg HH. Adult height prediction models. In: Handbook of Growth and Growth Monitoring in Health and Disease. Springer; 2012.

Version live today: Youth Growth 0.5.1, in the BQ Calculators v0.14.92.

This calculator is part of the BQ Calculators, for members. Enter the measurements once and run every calculator.

Other calculators: 5-Way Fractionation · Wrestling Minimum Weight · Full Level 2 Report · Muscle to Bone Ratio and Goals · TEM: my measurement error